Home / Products
DESCRIPTION
Post-Processing, Data Visualization and Mapping Software for BioSonics DT-X and MX Echosounder Systems
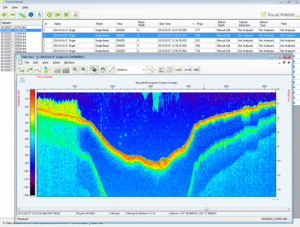
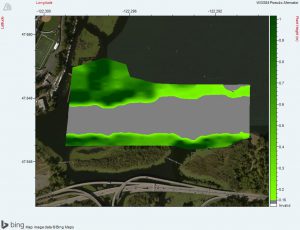
Use Visual Habitat to quickly visualize aquatic habitat data and generate full color contour maps in just minutes.
Determine bathymetry, submerged plant canopy height and percent cover, delineate areas of sand, mud, rock and other substrates. Display synchronized echogram and map views and visualize your results like never before.


